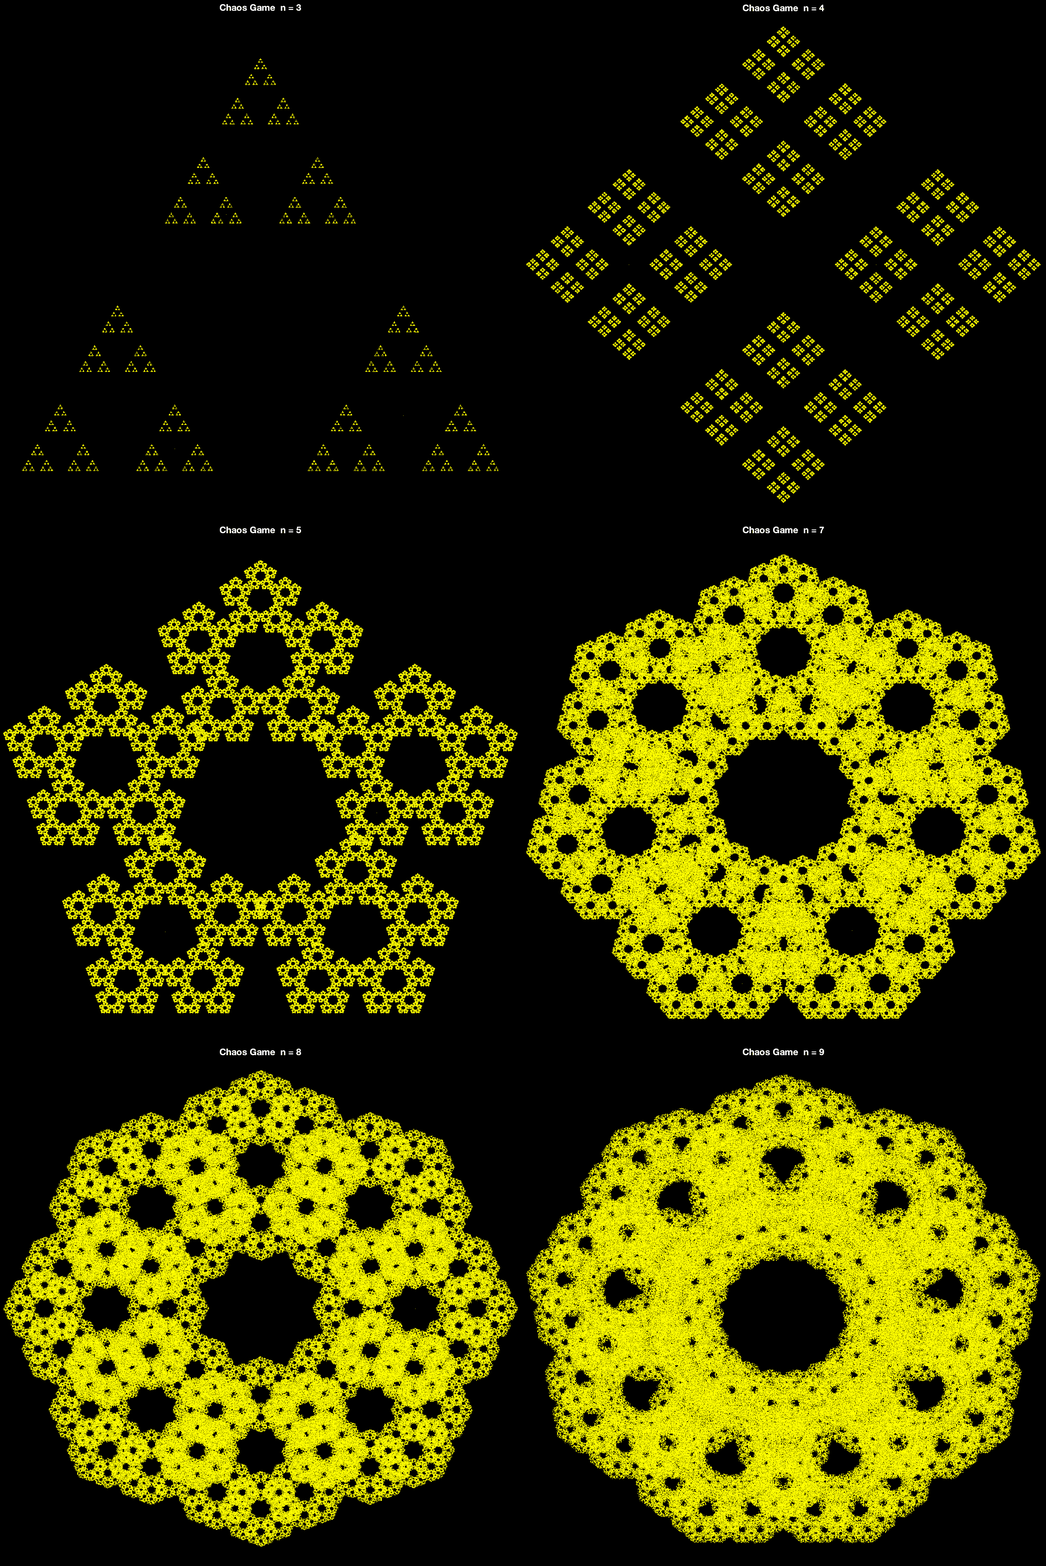
Chaos Game
Barnsley fern
-

-
clc; clear; close all

%% Parameters
maxIter = 1e6; % Max number of dice rolls
gifFilename = 'matlab_chaos_game_gif_fern.gif';

%% Initialization
xx = zeros(1, maxIter);
yy = zeros(1, maxIter);
x_0 = [0; 0];

%% Generating points
frameIter = 1; % Start with the first frame
for i = 1:maxIter
    % Randomly choose a transformation
    randx = randi([1 100]);
    if randx == 1
        x_0 = [0 0;
               0 0.16] * x_0;
    elseif randx <= 86
        x_0 = [0.85 0.04;
              -0.04 0.85] * x_0 + [0; 1.60];
    elseif randx <= 93
        x_0 = [0.20 -0.26;
               0.23 0.22] * x_0 + [0; 1.60];
    else
        x_0 = [-0.15 0.28;
                0.26 0.24] * x_0 + [0; 0.44];
    end

    % Store the generated point
    xx(1, i) = x_0(1);
    yy(1, i) = x_0(2);

    % Save frames for powers of 2
    if i == frameIter || i == maxIter
        % Plot the points
        figure(1); clf;
        set(gcf, 'Position', [100, 100, 800, 800], 'Color', 'none'); % Make figure background transparent
        ax = axes('Position', [0 0 1 1], 'Visible', 'off'); % Remove axes
        hold on;
        sz = 1;
        c = linspace(1, 100, i);
        scatter(xx(1:i), yy(1:i), sz, c, 'filled');

        % Add title
        text(0, 10.5, ['Chaos Game - Iteration ' num2str(i)], ...
            'HorizontalAlignment', 'center', 'FontSize', 14, 'Color', 'k');

        axis equal;
        axis([-3 3 0 10]); % Adjust the axis limits for better visualization
        drawnow;

        % Capture frame and write to GIF
        frame = getframe(gcf);
        img = frame2im(frame);
        [imind, cm] = rgb2ind(img, 256);

        if i == 1
            imwrite(imind, cm, gifFilename, 'gif', 'Loopcount', inf, 'DelayTime', 0.3);
        else
            imwrite(imind, cm, gifFilename, 'gif', 'WriteMode', 'append', 'DelayTime', 0.3);
        end

        % Update to the next power of 4
        frameIter = frameIter * 4;
    end
end
disp(['GIF saved as ', gifFilename]);
Regular Polygons
-

-
%% Purpose: General case of Chaos Game for N vertex Regular Poly
clc; clear; close all;

%% Input
n = 6;                       % number of vertices
r = 1;                       % scaling of unit circle
c = [0, 0];                  % center of circle

divisionFactor = [2.5 2.5];  % Case [d d]: x_new = (x_old + vertex)/d
                             % Case [a b]: d = a + (b - a)*rand(1)
                             %             x_new = (x_old + vertex)/d
                             % NOTE: for d<2 system explodes

diceRepeatCheck = [1 1];     % min max of number of consecutive repeated dice rolls
numofDiceRolles = 1000000;   % number of points generated
plotBoarderToggle = false;
gifFilename = 'matlab_chaos_game_reg_poly.gif';

%% Make Regular Poly
vertexCoord = RegularPolyGenerator(n, r, c);

%% Start the Game
% Grid
xx = zeros(1, numofDiceRolles);
yy = zeros(1, numofDiceRolles);

% Initial Point
x_0 = [0, 0];

%% Start Rolling
frameIter = 1; % Start with the first frame (power of 2)
for i = 1:numofDiceRolles
    % Roll the N-sided dice
    dice_number = randi([1 n]);
    closest_vertex = vertexCoord(dice_number, :);

    % Calculate division factor
    minF = divisionFactor(1);
    maxF = divisionFactor(2);
    d = minF + (maxF - minF) * rand(1);

    % Compute new point
    x_0 = (x_0 + closest_vertex) / d;
    xx(1, i) = x_0(1);
    yy(1, i) = x_0(2);

    % Save frames for GIF at powers of 2
    if i == frameIter || i == numofDiceRolles
        % Plot the points
        figure(1); clf;
        set(gcf, 'Position', [100, 100, 800, 800], 'Color', 'k'); % Black background
        hold on;

        % Plot the polygon in yellow
        if plotBoarderToggle
            plotBoarder(vertexCoord, n, 'y');
        end

        % Plot points in cyan
        scatter(xx(1:i), yy(1:i), 1, 'c', 'filled');
        axis equal;
        set(gca, 'Color', 'k', 'XColor', 'none', 'YColor', 'none'); % Black axes background
        drawnow;

        % Capture frame and write to GIF
        frame = getframe(gcf);
        img = frame2im(frame);
        [imind, cm] = rgb2ind(img, 256);

        if i == 1
            imwrite(imind, cm, gifFilename, 'gif', 'Loopcount', inf, 'DelayTime', 0.3);
        else
            imwrite(imind, cm, gifFilename, 'gif', 'WriteMode', 'append', 'DelayTime', 0.3);
        end

        % Update to the next power of 2
        frameIter = frameIter * 2;
    end
end
disp(['GIF saved as ', gifFilename]);

%% Functions
function plotBoarder(vertexCoord, n, color)
    hold on;
    for i = 1:n-1
        line(vertexCoord(i:i+1, 1), vertexCoord(i:i+1, 2), 'color', color, 'LineWidth', 1.5);
    end
    line([vertexCoord(1, 1), vertexCoord(n, 1)], ...
         [vertexCoord(1, 2), vertexCoord(n, 2)], 'color', color, 'LineWidth', 1.5);
end

function vertexCoord = RegularPolyGenerator(n, r, c)
    alpha = 0;
    cNodeAngle = 2 * pi / n;
    vertexCoord = zeros(n, 2);
    for i = 1:n
        vertexCoord(i, :) = r * [sin(alpha), cos(alpha)] + c;
        alpha = alpha + cNodeAngle;
    end
end
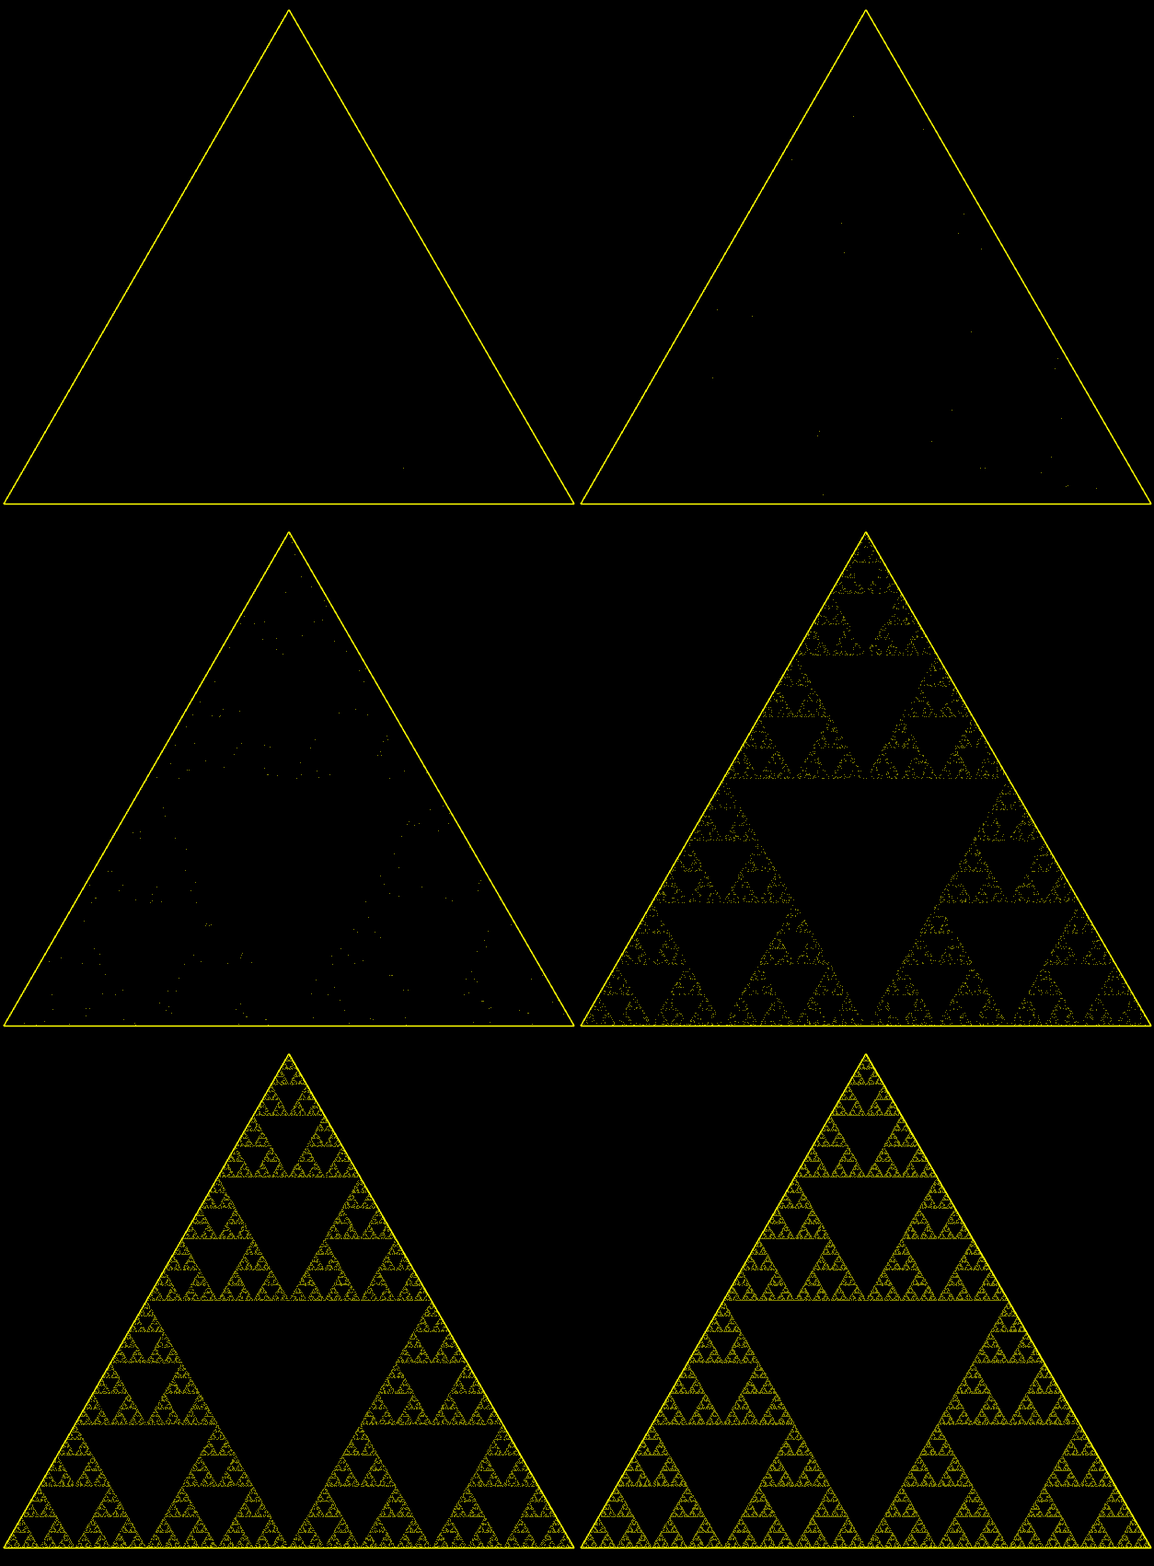
Sierpinski Triangle
-

-
clc; clear; close all

%% Parameters
maxIter     = 1e6; % Max number of dice rolls
gifFilename = 'matlab_chaos_game_eq_triangle.gif';

%% Triangle Vertices
v1.x = 0;   v1.y = 0;
v2.x = 1;   v2.y = 0;
v3.x = 1/2; v3.y = sqrt(3)/2;

%% Pick Random Initial Point Inside the Triangle
r1 = rand(); r2 = rand();
if r1 + r2 > 1
    r1 = 1 - r1;
    r2 = 1 - r2;
end

% Compute the random point as a linear combination of the vertices
x0 = (1 - r1 - r2) * [v1.x, v1.y] + ...
     r1 * [v2.x, v2.y] + ...
     r2 * [v3.x, v3.y];

%% Grid for storing points
xx = zeros(1, maxIter);
yy = zeros(1, maxIter);

%% Generating points
closest_v = [0, 0];
frameIter = 1;

for i = 1:maxIter
    % Randomly select a vertex based on dice roll
    dice_number = randi([1, 6]);
    switch dice_number
        case {1, 2}
            closest_v = v1;
        case {3, 4}
            closest_v = v2;
        case {5, 6}
            closest_v = v3;
    end

    % Compute the midpoint
    x0 = (x0 + [closest_v.x, closest_v.y]) ./ 2;
    xx(1, i) = x0(1);
    yy(1, i) = x0(2);

    % Save frames for powers of 2
    if i == frameIter || i == maxIter
        figure(1); clf;
        set(gcf, 'Position', [100, 100, 800, 800], 'Color', 'k'); % Black background
        hold on;

        % Plot the triangle in yellow
        line([v1.x, v2.x], [v1.y, v2.y], 'color', 'y', 'LineWidth', 1.5);
        line([v1.x, v3.x], [v1.y, v3.y], 'color', 'y', 'LineWidth', 1.5);
        line([v2.x, v3.x], [v2.y, v3.y], 'color', 'y', 'LineWidth', 1.5);

        % Plot points in yellow
        scatter(xx(1:i), yy(1:i), 1, 'y', 'filled');
        axis equal;
        set(gca, 'Color', 'k', 'XColor', 'none', 'YColor', 'none'); % Black axes background
        drawnow;

        % Capture frame and write to GIF
        frame = getframe(gcf);
        img = frame2im(frame);
        [imind, cm] = rgb2ind(img, 256);

        if i == 1
            imwrite(imind, cm, gifFilename, 'gif', 'Loopcount', inf, 'DelayTime', 0.3);
        else
            imwrite(imind, cm, gifFilename, 'gif', 'WriteMode', 'append', 'DelayTime', 0.3);
        end

        % Update to the next power of 3
        frameIter = frameIter * 3;
    end
end
disp(['GIF saved as ', gifFilename]);